

 Martin Begley
Adaptive Tips & Tricks: Consistent Currency Reporting
 Martin Begley : Feb 14, 2018, 8:41:00 AM
Constant currency removes the affects of exchange rates to give you an accurate view of your business' performance.
It’s easy to create Discovery dashboard dials right from your planning sheets. Instead of launching Discovery, highlighting a data range on your planning sheet provides an easy way to visualize the data you want to capture.
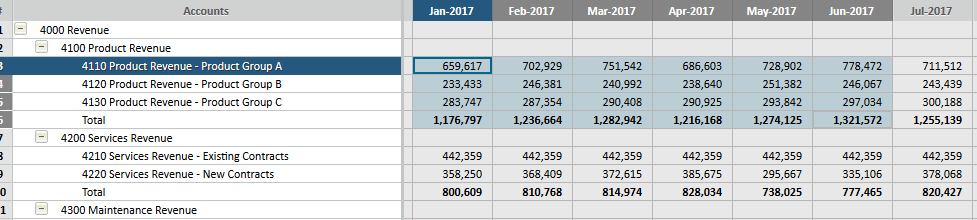
Once highlighted, simply press the Chart icon on the menu bar and the chart is created for you.

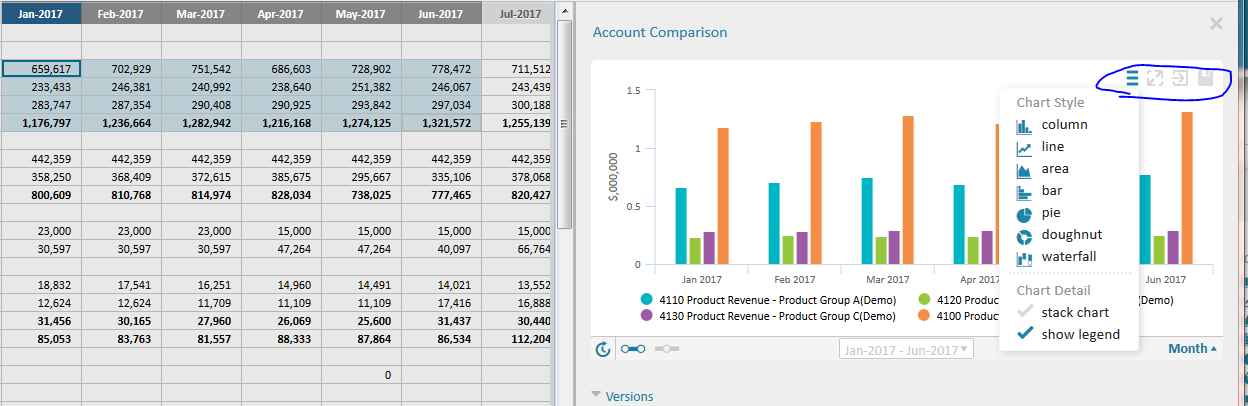
You can then change the chart to a variety of styles including line, area, bar, pie charts etc. by clicking the Chart Style navigation icon. When you have made the changes you like, save the chart as a Discovery dashboard by clicking the Save to Discovery icon.
To view your graph in Discovery, launch Discovery and open your perspective. The graph will be there for you to resize or position on the dashboard as you like.
Happy Dash-boarding!
Want to learn more about Adaptive Insights?
Business Solution Partners provides a wealth of Adaptive services, from onboarding to training, designed to help businesses unlock the potential of the CPM platform to realize new efficiences, financial transparency, and overall operational success.
 Martin Begley : Feb 14, 2018, 8:41:00 AM
Constant currency removes the affects of exchange rates to give you an accurate view of your business' performance.

 Workday Adaptive Planning : Jan 21, 2021, 9:00:00 AM
The COVID-19 pandemic required an agile response, with many businesses shifting their focus to digital growth.
 Workday Adaptive Planning : Feb 18, 2021, 9:00:00 AM
To create an analytics mindset within your finance team, identify an advocate at the top, attract and retain the right talent, use technology...
